Most FP&A Teams Are Rebuilding the Same File Every Month
A different Excel file for each close cycle. Variance formulas copied from last month, manually adjusted. The PVM bridge is a simplified two-way split that misses the interaction effect. The rolling forecast is a column of paste-as-values. By the time the board deck is ready, the narrative is already outdated and the methodology is impossible to audit.
The problem is not the analyst. It is the tooling. A properly structured FP&A workbook should require one data entry point per close cycle — actuals go in, and the variance analysis, bridge, forecast, and dashboard all update automatically. No manual overrides. No copy-paste. No rebuilding.
$97
One-time. Replace it with your own budget and actuals in under an hour. Use it every month-end, indefinitely.
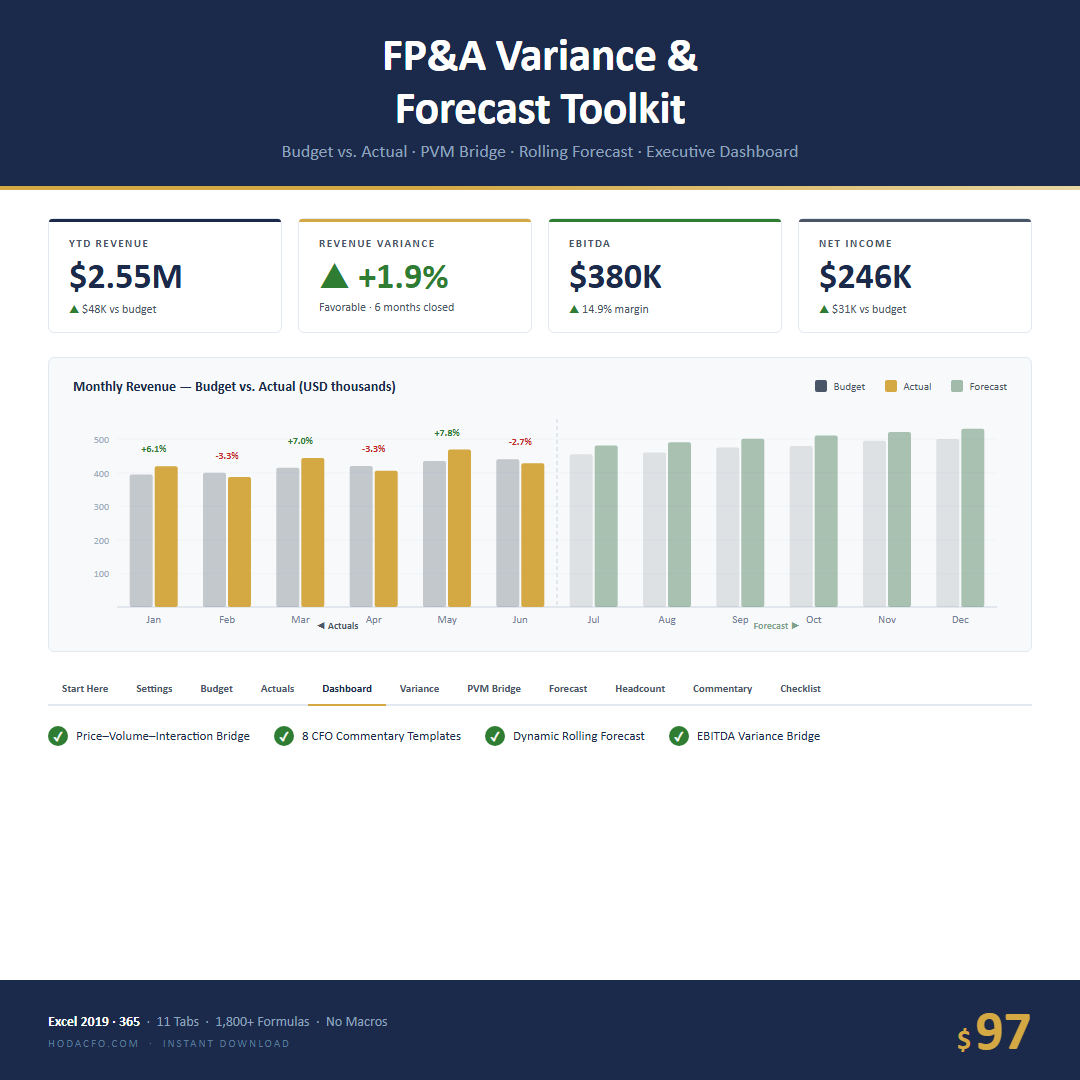
What You Get Inside
Features
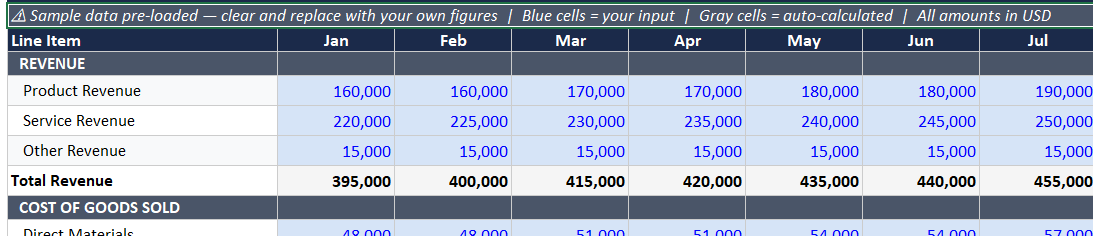
- ✓ 12-Month Variance Analysis — Revenue, COGS, Gross Profit, OpEx, EBITDA, Net Income — all 12 months on one sheet. Every line vs. budget with favorable/adverse color coding, YTD column, and full-year summary. No manual calculations.
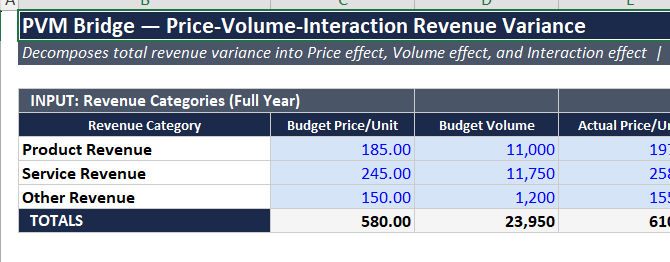
- ✓ PVM Bridge (Price – Volume – Interaction) — The correct three-way decomposition. Enter budget and actual price/volume for each revenue line. The Price variance, Volume variance, and Interaction effect calculate automatically. Most templates use the simplified two-way split that misses the interaction term — this one does not.
- ✓ Rolling Forecast with Auto-Lock — Set the closed-through month in Settings. Closed months lock to actuals automatically. Open months remain editable as your best-estimate forecast. No manual overrides, no copy-paste.
- ✓ Headcount Plan — Budget vs. actual headcount by department with P&L reconciliation. Total loaded headcount cost ties directly to the Salaries & Wages budget line — so your people-cost explanation is always grounded in the budget.
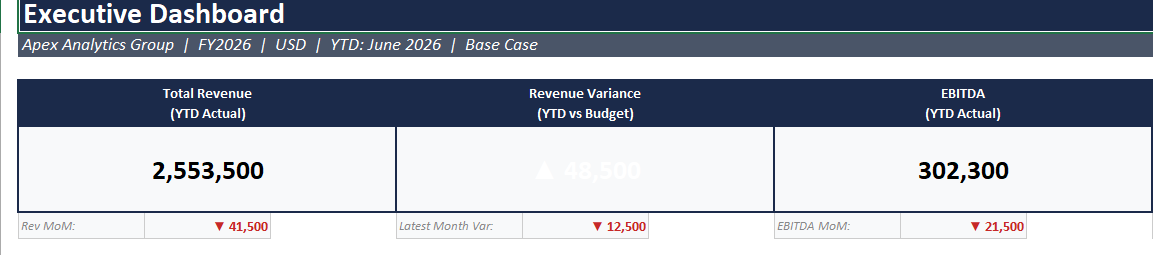
- ✓ Executive Dashboard — One-page summary: Revenue Var, EBITDA Var, Net Income Var, YTD closed months, 12-month budget vs. actual bar charts, and EBITDA variance bridge. Board-ready without additional formatting.
- ✓ 8 Commentary Templates — Board-ready narrative blocks for favorable revenue variance, adverse margin variance, mixed quarter, reforecast rationale, headcount miss, revenue-down-costs-down, and two more. Copy, customize, send.
- ✓ 21-Step Month-End Checklist — Every step in the close process, in order. Nothing gets missed. Works as a standalone tab or printed for your close binder.
- ✓ Zero Macros — No VBA, no Power Query, no structured tables that break on row insert. Pure Excel formulas throughout. Open on any machine without enabling anything.
- ✓ Sample Data Pre-Loaded — See every tab working before you enter a single number. Replace with your figures when ready.
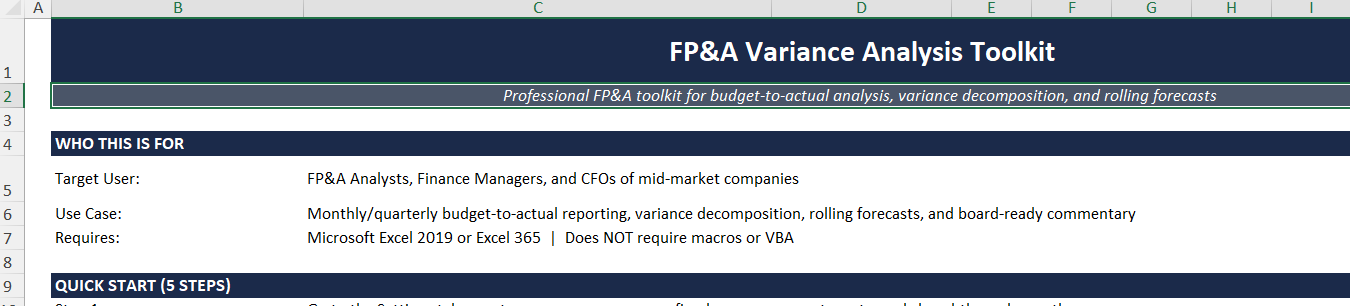
- ✓ Fully Documented Row Map — The Start Here tab explains every section, every input cell, and every formula driver. Add line items without breaking the model.