Most Valuation Models Fail at the Moment That Matters
I started asking that question after watching thousands of people lose money—not because they picked the wrong company, but because they had no framework for knowing what it was actually worth.
The problem was never knowledge. The gap was always tooling—a model built to the standard that actually holds up, with every input sourced, every assumption documented, and every output explainable under pressure. Too many investment decisions are presented with confidence, then challenged on the most basic question: where did this number come from?
$97
A single valuation engagement: $5,000–$50,000. This model: $97.
What You Get
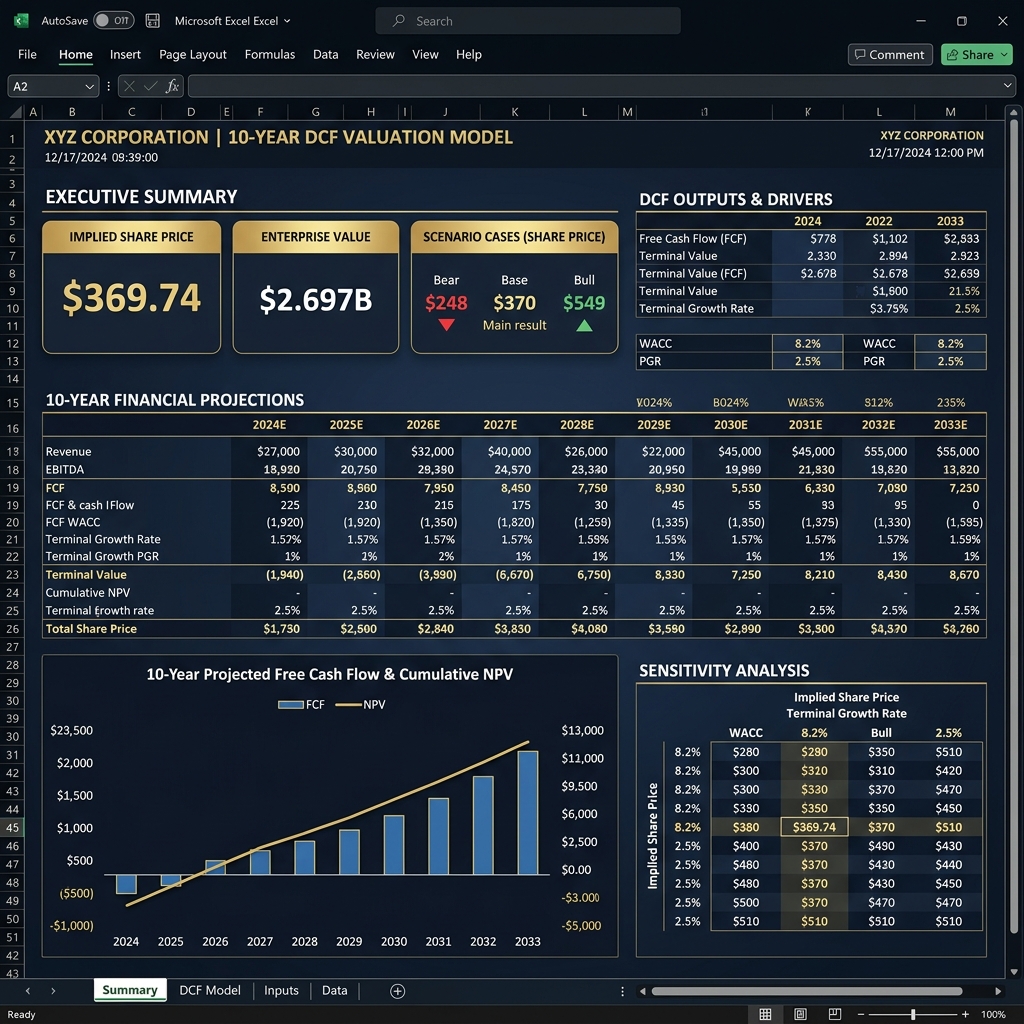
✓ 10-Year DCF Projection Engine — Build a full discounted cash flow forecast over ten years with free cash flow projections, terminal value calculation, and a clean output waterfall.✓ WACC Builder — Complete cost of equity (CAPM-based with beta, risk-free rate, equity risk premium) and cost of debt inputs with automatic weighting to deliver a precise discount rate.✓ 3-Scenario Analysis — Bear, Base, and Bull cases with fully linked outputs—$248, $370, and $549 implied share price on the pre-loaded Microsoft example.✓ Sensitivity Analysis Table — See how share price moves as terminal growth rate and WACC change across a two-dimensional grid—no manual calculation required.✓ Enterprise Value & Implied Share Price — At base case: Enterprise Value of $2,697B and Implied Share Price of $369.74—every intermediate step visible and auditable.✓ AI Commentary Layer — Prompt-based prompts that generate a CFO-grade narrative around your model outputs—use them in board decks, investment memos, or client presentations.✓ CFO Narrative Template — A board-ready valuation summary template that frames every assumption, scenario, and output in the language of institutional investment committees.✓ Model Governance Layer — Every assumption is documented and sourced—no orphan numbers. A full audit trail so you can defend every input under scrutiny.✓ ±15% Threshold Flagging — Automatic flagging when outputs move beyond materiality thresholds with explainable gap analysis that shows exactly what drove the change.✓ ROIC vs WACC Spread Analysis — Evaluate competitive advantage duration by comparing return on invested capital against the cost of capital over the full projection period.